Using the remove_lightleak function to analyze XRT composite images
The remove_lightleak function is built to subtract light leak (visible stray light) image from XRT synoptic composite images. Level two synoptic composite image data is available at xrt.cfa.harvard.edu. This template will guide you through the method of using remove_lightleak.
Begin by importing remove_lightleak function from XRTpy.
[2]:
import pkg_resources
import sunpy.map

from xrtpy.image_correction.remove_lightleak import remove_lightleak
/tmp/ipykernel_1540/490298938.py:1: DeprecationWarning: pkg_resources is deprecated as an API. See https://setuptools.pypa.io/en/latest/pkg_resources.html
  import pkg_resources
/home/docs/checkouts/readthedocs.org/user_builds/xrtpy/envs/latest/lib/python3.11/site-packages/tqdm/auto.py:21: TqdmWarning: IProgress not found. Please update jupyter and ipywidgets. See https://ipywidgets.readthedocs.io/en/stable/user_install.html
  from .autonotebook import tqdm as notebook_tqdm
This example will be using XRT synoptic data from the first day of summer of 2015.
[3]:
File used:
 comp_XRT20150621_055911.7.fits
Take on `sunpy.map.Map <https://docs.sunpy.org/en/stable/code_ref/map.html>`__ to run the composite data file.
[4]:
in_map = sunpy.map.Map(data_file)
The remove_lightleak function takes a `sunpy.map.Map <https://docs.sunpy.org/en/stable/code_ref/map.html>`__ as input and returns the composite image and metadata as a Map.
[5]:
out_map = remove_lightleak(in_map)
Files Downloaded:   0%|          | 0/1 [00:00<?, ?file/s]
xrtpy.term_p2am_20150718_160913.fits:   0%|          | 0.00/4.21M [00:00<?, ?B/s]
xrtpy.term_p2am_20150718_160913.fits:   2%|▏         | 97.0k/4.21M [00:00<00:04, 957kB/s]
xrtpy.term_p2am_20150718_160913.fits:  69%|██████▉   | 2.90M/4.21M [00:00<00:00, 16.8MB/s]
Files Downloaded: 100%|██████████| 1/1 [00:00<00:00,  2.97file/s]
[6]:
import matplotlib.pyplot as plt
from matplotlib.colors import LogNorm
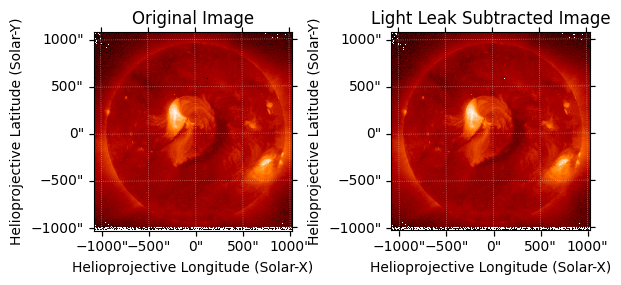
fig = plt.figure()
ax1 = fig.add_subplot(1, 2, 1, projection=in_map)
in_map.plot(axes=ax1, title="Original Image", norm=LogNorm(1.0, None))
ax2 = fig.add_subplot(1, 2, 2, projection=out_map)
out_map.plot(axes=ax2, title="Light Leak Subtracted Image", norm=LogNorm(1.0, None))
fig.subplots_adjust(wspace=0.5)
plt.show()